Ocean gyres, enigmatic and colossal, stand as intricate wonders of our planet’s aquatic realm. These immense circular currents, driven by the interplay of wind, Earth’s rotation, and geographical features, hold profound significance in shaping our oceans’ dynamics. In this exploration, we delve into the formation, characteristics, and ecological impact of ocean gyres, unraveling their mysteries to comprehend their vital role in Earth’s biosphere.
Unveiling Ocean Gyres: Nature’s Vast Water Whirlpools
Ocean gyres, monumental in scale, are intricate manifestations of Earth’s hydrodynamic systems. These immense circular rotations, primarily driven by the Coriolis effect and wind patterns, span vast expanses of our planet’s oceans. Comprehending their formation necessitates understanding the intricate interplay of forces shaping our planet’s aquatic dynamics.
As wind patterns interact with Earth’s rotation, they induce the movement of oceanic waters, initiating the formation of these massive gyres. However, it’s not merely wind and rotation that define gyres; the presence of continents delineates their size and shape, sculpting their trajectories across the oceanic expanse.
Navigating Ocean Gyres: Earth’s Aquatic Marvels
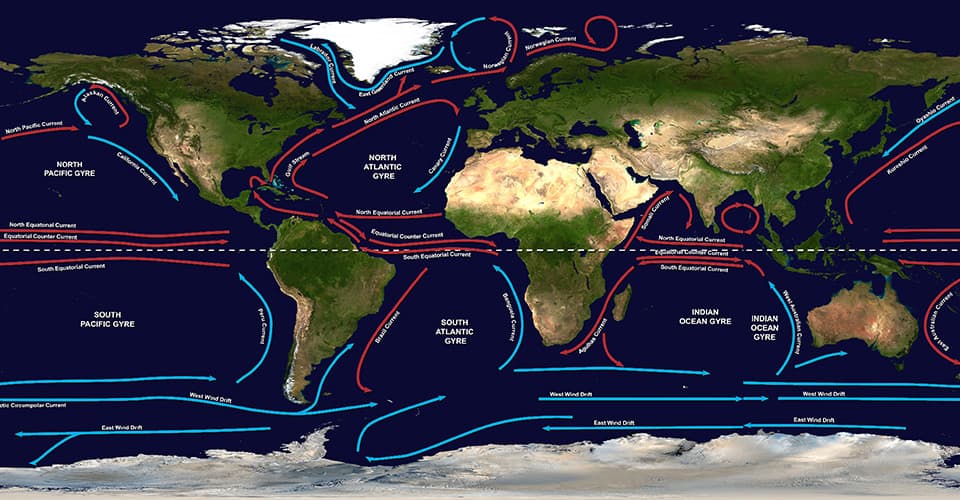
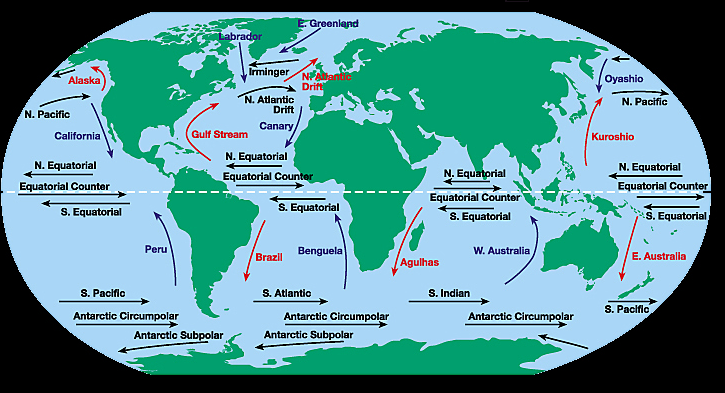
The world’s oceans host five major gyres, each bearing distinctive characteristics dictated by their geographical locations. From the expansive North Pacific Gyre to the South Atlantic Gyre, these colossal whirlpools play a pivotal role in governing oceanic circulation patterns. Furthermore, subtropical, tropical, and subpolar gyres exhibit unique traits, shaping marine environments and influencing biodiversity. However, alongside their natural significance, ocean gyres serve as focal points for environmental concern, particularly regarding plastic pollution accumulation and its detrimental impact on marine ecosystems.
Where is the ocean gyre located?
Ocean gyres are located in various parts of the world’s oceans. They are large systems of circulating currents driven primarily by wind patterns, the Earth’s rotation (Coriolis effect), and differences in water temperature and salinity.
Here are some of the major ocean gyres and their locations:
- North Atlantic Gyre: Located in the North Atlantic Ocean;
- South Atlantic Gyre: Located in the South Atlantic Ocean;
- North Pacific Gyre: Located in the North Pacific Ocean;
- South Pacific Gyre: Located in the South Pacific Ocean;
- Indian Ocean Gyre: Located in the Indian Ocean;
- Antarctic Circumpolar Current: Circulates around Antarctica in the Southern Ocean.
These gyres play crucial roles in shaping global climate patterns, distributing heat around the Earth, and influencing marine ecosystems.
How is a map of ocean currents made?
Maps of ocean currents are created using a combination of satellite data, oceanographic instruments, and computer modeling. Here’s an overview of the process:
- Satellite Observations: Satellites equipped with instruments such as altimeters and scatterometers measure various properties of the ocean surface, including sea level, sea surface temperature, and surface winds. These satellite observations provide valuable data on surface currents, which are influenced by wind patterns;
- Drifter Buoy Data: Drifter buoys are instruments deployed into the ocean to track surface currents. These buoys are equipped with GPS devices and sensors to measure temperature, salinity, and other parameters. By tracking the movement of drifter buoys over time, scientists can gather data on ocean currents;
- Oceanographic Instruments: Ship-based instruments, such as Acoustic Doppler Current Profilers (ADCPs) and Conductivity, Temperature, and Depth (CTD) probes, are used to measure currents and other properties of the water column at various depths. These in-situ measurements provide valuable data for validating satellite observations and computer models;
- Computer Modeling: Oceanographers use computer models, known as ocean circulation models, to simulate the complex dynamics of ocean currents. These models take into account factors such as wind forcing, temperature gradients, and the shape of the ocean basins. By running simulations with these models, scientists can predict the behavior of ocean currents under different conditions and produce maps of current patterns;
- Data Assimilation: Observational data from satellites, drifters, and oceanographic instruments are assimilated into ocean circulation models to improve their accuracy. Data assimilation techniques help to adjust the model simulations based on real-world observations, resulting in more reliable predictions of ocean currents;
- Map Generation: Finally, the data from satellite observations, drifters, oceanographic instruments, and computer models are synthesized to create maps of ocean currents. These maps typically show the direction and speed of surface currents, as well as major features such as gyres, boundary currents, and eddies.
Overall, creating maps of ocean currents involves a combination of observational data collection, numerical modeling, and data analysis techniques to better understand the complex dynamics of the ocean.
Where ocean current maps are used?
<iframe width=”560″ height=”315″ src=”https://www.youtube.com/embed/ftHomiQRhMA?si=I9ROchxfGYKoUOoZ” title=”YouTube video player” frameborder=”0″ allow=”accelerometer; autoplay; clipboard-write; encrypted-media; gyroscope; picture-in-picture; web-share” allowfullscreen></iframe>
Ocean current maps are made using a combination of satellite data, in-situ measurements from buoys, ships, and other oceanographic instruments, as well as computer models. Here’s a general overview of the process:
- Satellite Data: Satellites equipped with instruments such as altimeters and scatterometers can measure sea surface height, temperature, and surface winds. These data are crucial for understanding large-scale ocean circulation patterns;
- In-Situ Measurements: Buoys, ships, and underwater instruments provide direct measurements of ocean currents, temperature, salinity, and other relevant parameters. These measurements help validate satellite data and provide more detailed information about local currents;
- Computer Models: Oceanographers use numerical models to simulate ocean circulation based on physical principles such as fluid dynamics, thermodynamics, and the Coriolis effect. These models integrate observational data and help predict ocean currents in regions lacking direct measurements;
- Data Assimilation: Observational data from satellites and in-situ measurements are assimilated into computer models to improve their accuracy and reliability. This process helps correct biases and uncertainties in the models and produces more realistic simulations of ocean currents;
- Visualization and Analysis: The processed data are then visualized and analyzed to create ocean current maps. These maps depict the direction, speed, and variability of ocean currents at different depths and locations. They may also include additional information such as sea surface temperature, salinity, and eddy features.
Ocean current maps are used in various applications, including:
- Navigation: Mariners use ocean current maps to plan routes, optimize fuel efficiency, and avoid strong currents that may affect vessel stability or travel time;
- Fishing: Fishermen use ocean current maps to locate productive fishing grounds where currents converge, bringing nutrients and plankton that attract fish;
- Weather Forecasting: Ocean current maps provide valuable input for weather forecasting models, especially for predicting the track and intensity of tropical cyclones, ocean storms, and other weather systems influenced by ocean currents;
- Climate Research: Ocean current maps help scientists study the dynamics of global ocean circulation, its role in climate variability and change, and its impact on marine ecosystems and the Earth’s climate system;
- Environmental Monitoring: Ocean current maps are used to track the dispersal of pollutants, marine debris, and oil spills, as well as to monitor the health of coral reefs and other sensitive marine habitats.
Overall, ocean current maps play a crucial role in understanding and managing the world’s oceans, supporting a wide range of scientific, commercial, and environmental applications.
Conclusion
Ocean gyres, majestic in their enormity, stand as testament to the intricate interplay of natural forces shaping our planet’s aquatic landscapes. From their formation to ecological impact, these colossal whirlpools wield profound influence on global climate patterns and marine biodiversity. However, the specter of environmental degradation looms large, underscoring the urgent need for collective action to mitigate plastic pollution and safeguard the integrity of our oceans. By fostering a deeper understanding of ocean gyres, we embark on a journey toward a more sustainable future, where the marvels of our planet’s aquatic realm endure for generations to come.